
The Board of Directors is a group of industry professionals and business leaders from Lehigh and Northampton Counties.
Discover Lehigh Valley® builds the region’s economy and image through destination marketing that increases the number of leisure and business visitors, the number of nights they stay, and the number of things they do in the two-county area of Lehigh and Northampton Counties. These marketing efforts also enhance the quality of life and sense of hometown pride for Lehigh Valley, PA residents.
The Annual Report from fiscal year 2024-25 is available. Download the full document or scroll through a brief synopsis below.


DLV's organic strategy continued to build momentum across nearly every channel. By leaning into video content, planning ahead with a robust content calendar, publishing more than 2,500 posts, we kept our audiences engaged and growing.

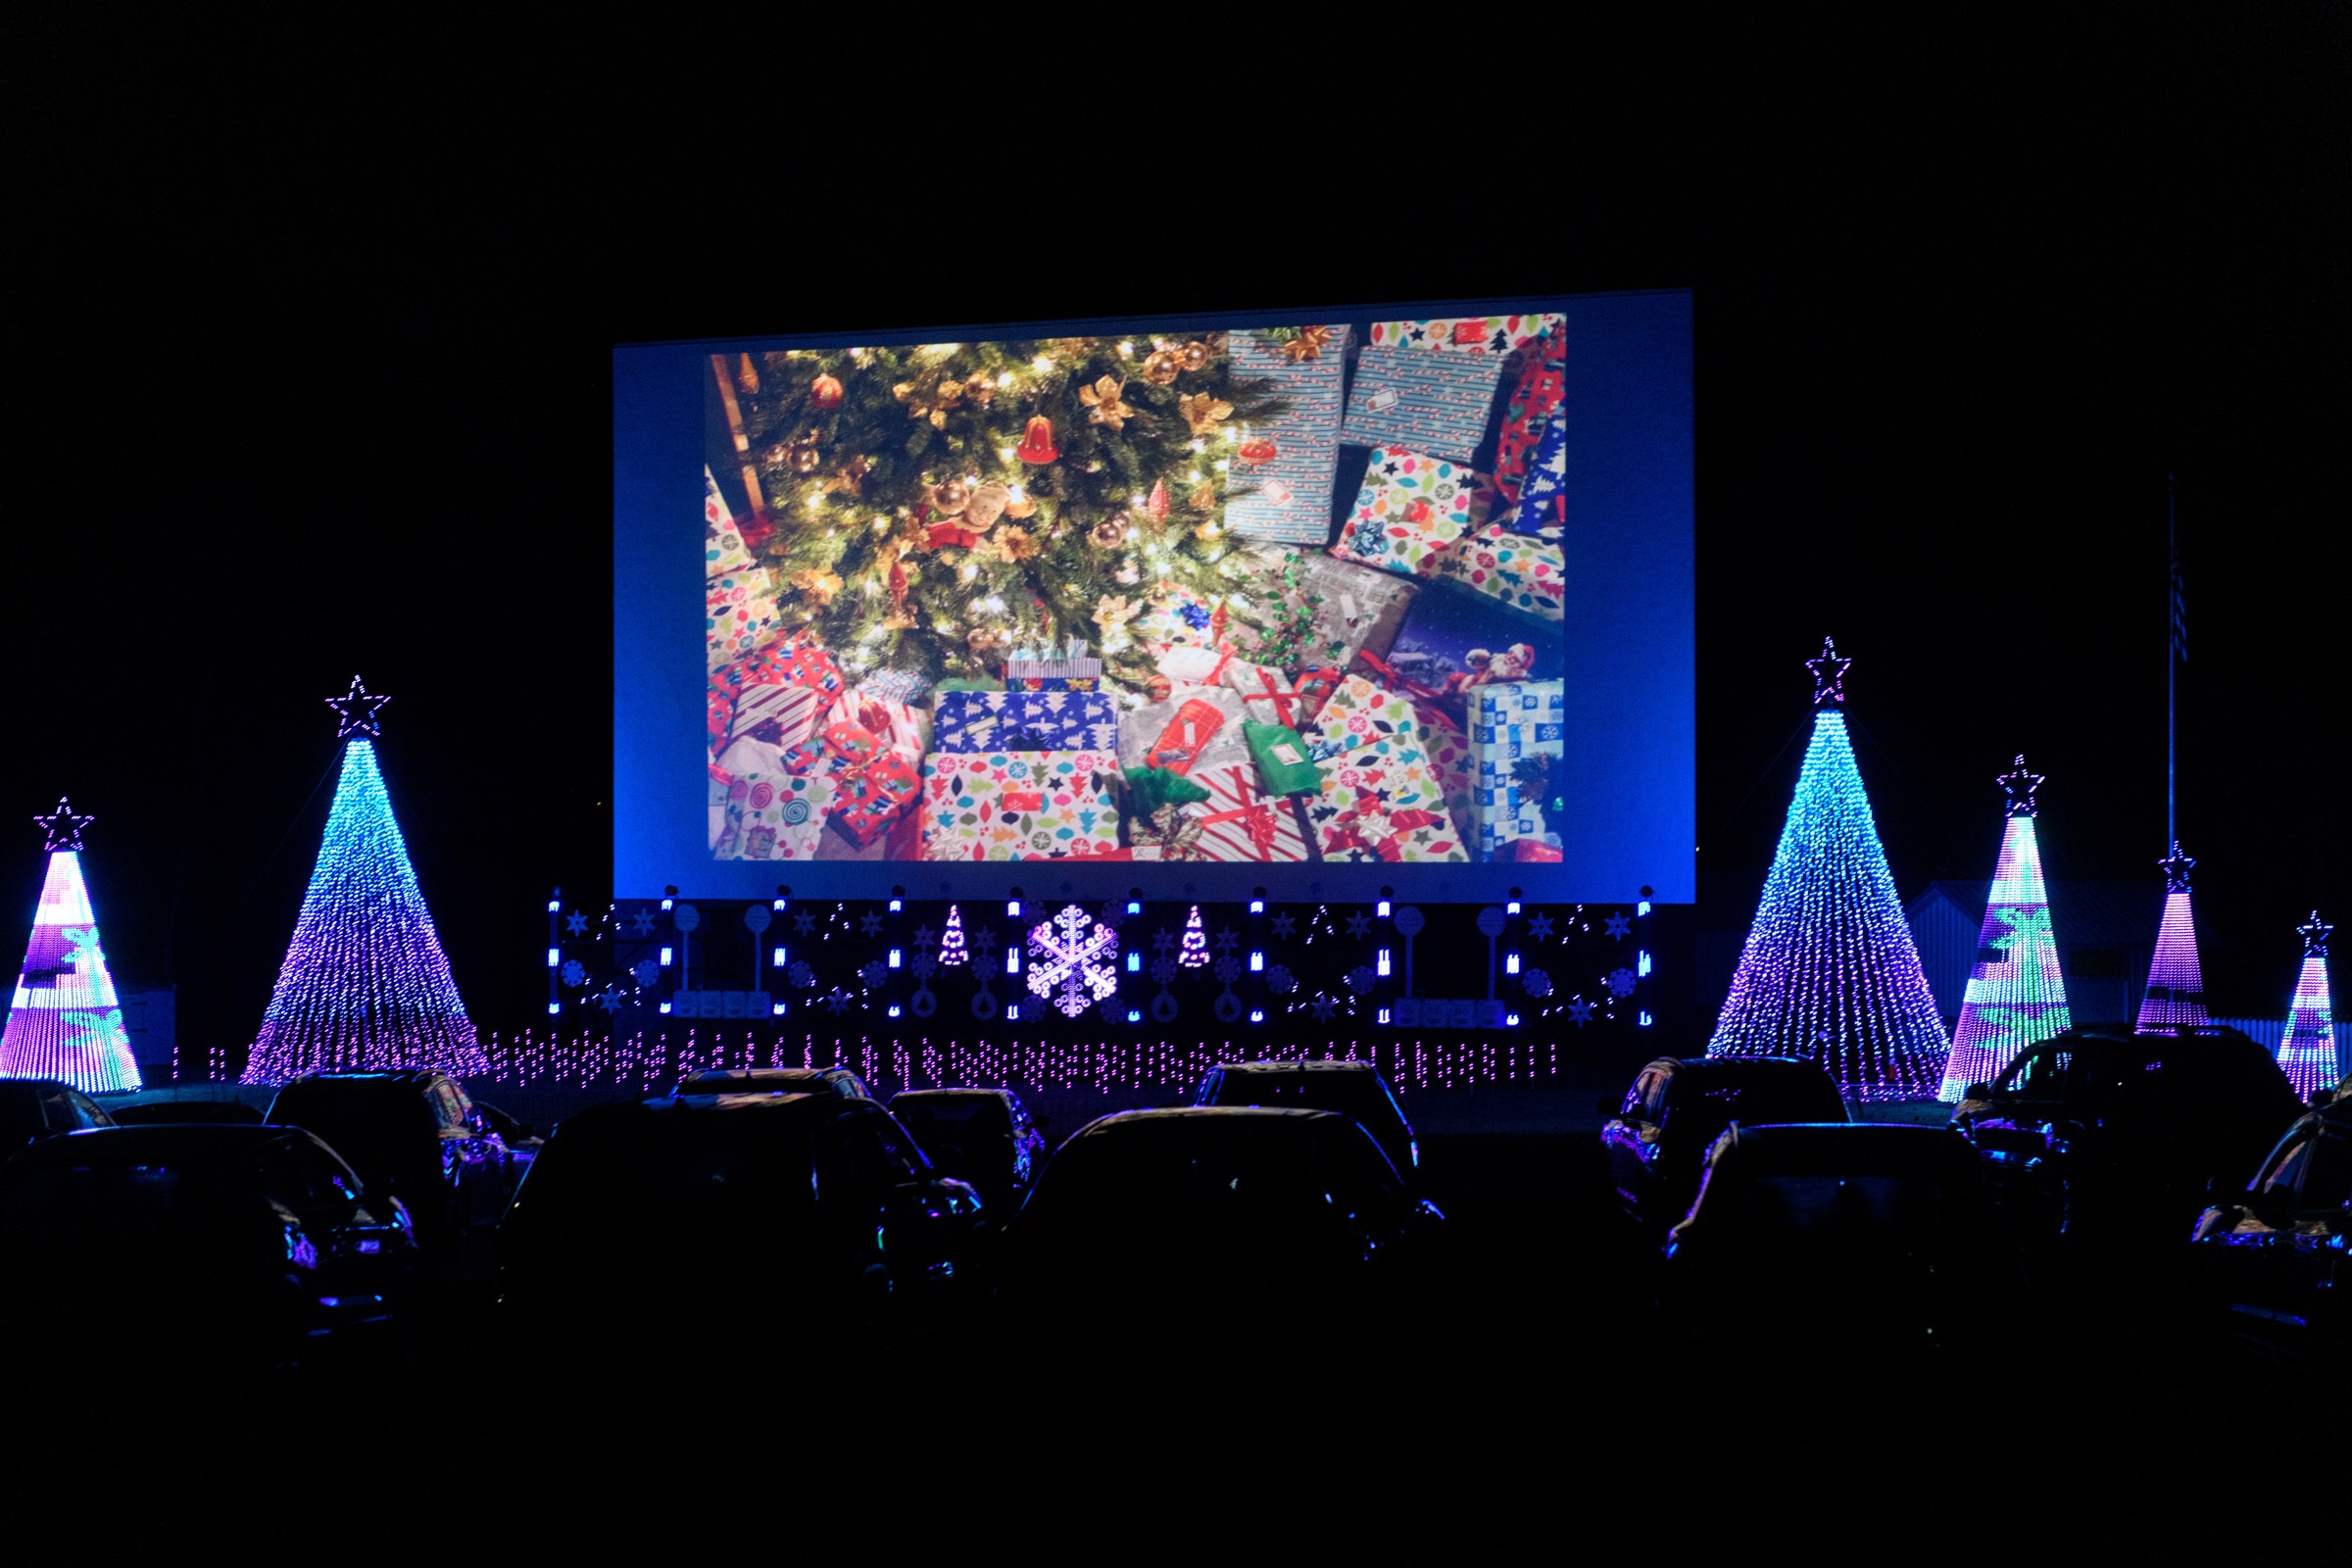
Creative elements featured It's Always Playtime (Crayola Experience, Dorney Park & Wildwater Kingdom, Martin Guitar), Holiday Magic (Easton Winter Village), A Mountain Bike Playground, while pairing with VisitPA.com’s “The Uncommon is Calling.” Target Markets: New York, Northern New Jersey, Philadelphia, HLLY, Washington, D.C., and Baltimore.
The marketing team continued promotion of World Heritage via international partnerships
with with BrandUSA and VisitTheUSA.com (Travel guide, 15 sites & 8 languages), as well as collaborative efforts through VisitPA.com.
DLV continued a significant out-of-home presence with Adams Outdoor across the region as a way to build awareness locally and welcome visitors to the region. Creative varied, promoting family-friendly memberships and events in Lehigh Valley, along with co-op'd partnerships with Allentown Art Museum, and more. DLV utilized the space to congratulate Moravian Church Settlements–Bethlehem on their World Heritage announcement in July 2024.

DLV generated strong regional and national visibility through targeted pitching, seasonal press releases, and customized FAM trip invitations. Although overall media impressions declined—a common election year trend—placement volume and value increased, underscoring the strength of our strategy.
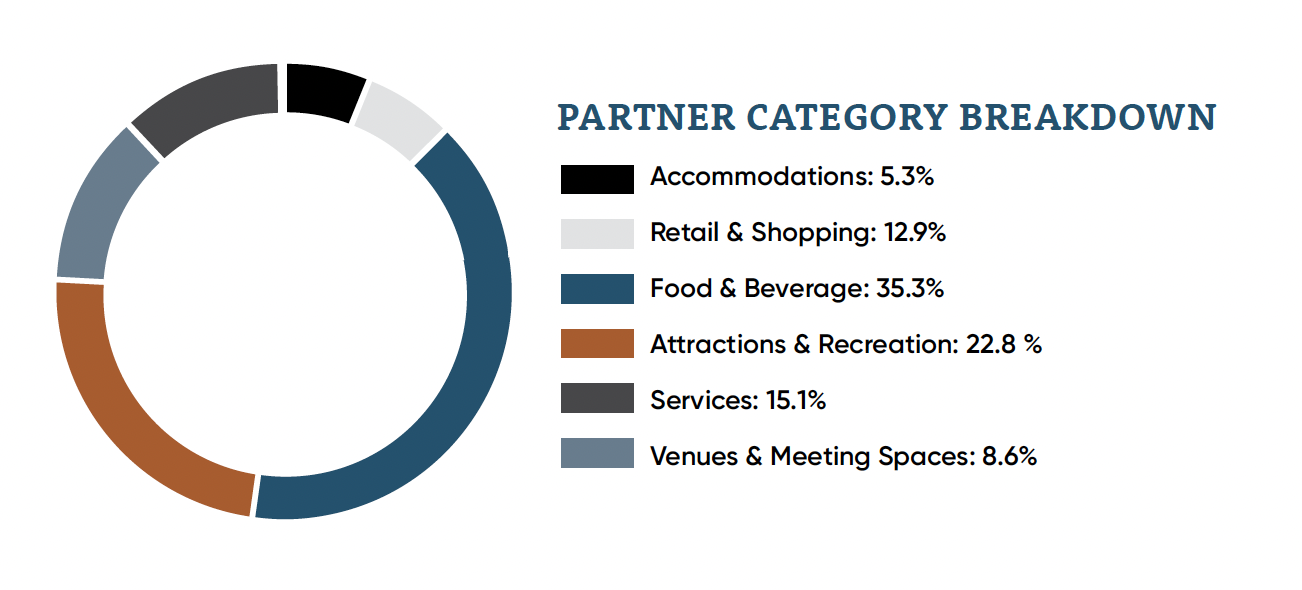
DLV partners are tourism-facing businesses across Lehigh and Northampton Counties that contribute to the rich diversity of experiences available to visitors each day. These businesses can participate in a wide range of services enhancing their visibility and engagement with visitors and residents.
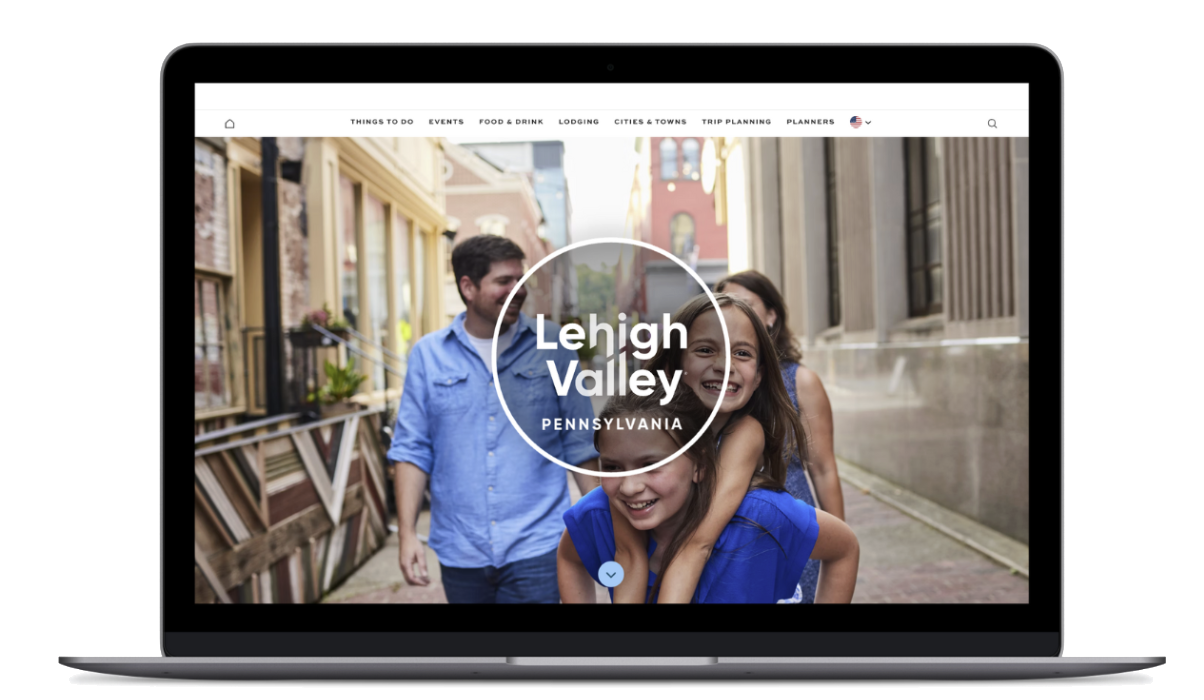
Website traffic surged in FY24–25, with total users up 60% and nearly 3.9M new visitors discovering DiscoverLehighValley.com.
Throughout the FY, DLV worked to transition and improve our website, database, and extranet. The site features smart tools, immersive content, and bold design enhancements to inspire exploration and drive tourism growth.
DLV generated 148 business opportunities for hotel, venue, and sports facility partners, achieving a 5% year-over-year increase and resulting in more than 13,000 hotel room nights booked. A key accomplishment during the fiscal year was the team’s successful collaboration with three strategic partners and the state tourism office to secure $130,000 in state grant funding. These funds provided direct support to DLV partners for both national and regional events, enhancing the region’s tourism infrastructure and further elevating the Lehigh Valley’s reputation as a premier destination for travel, meetings, and sporting events.
2025 High School National Invite
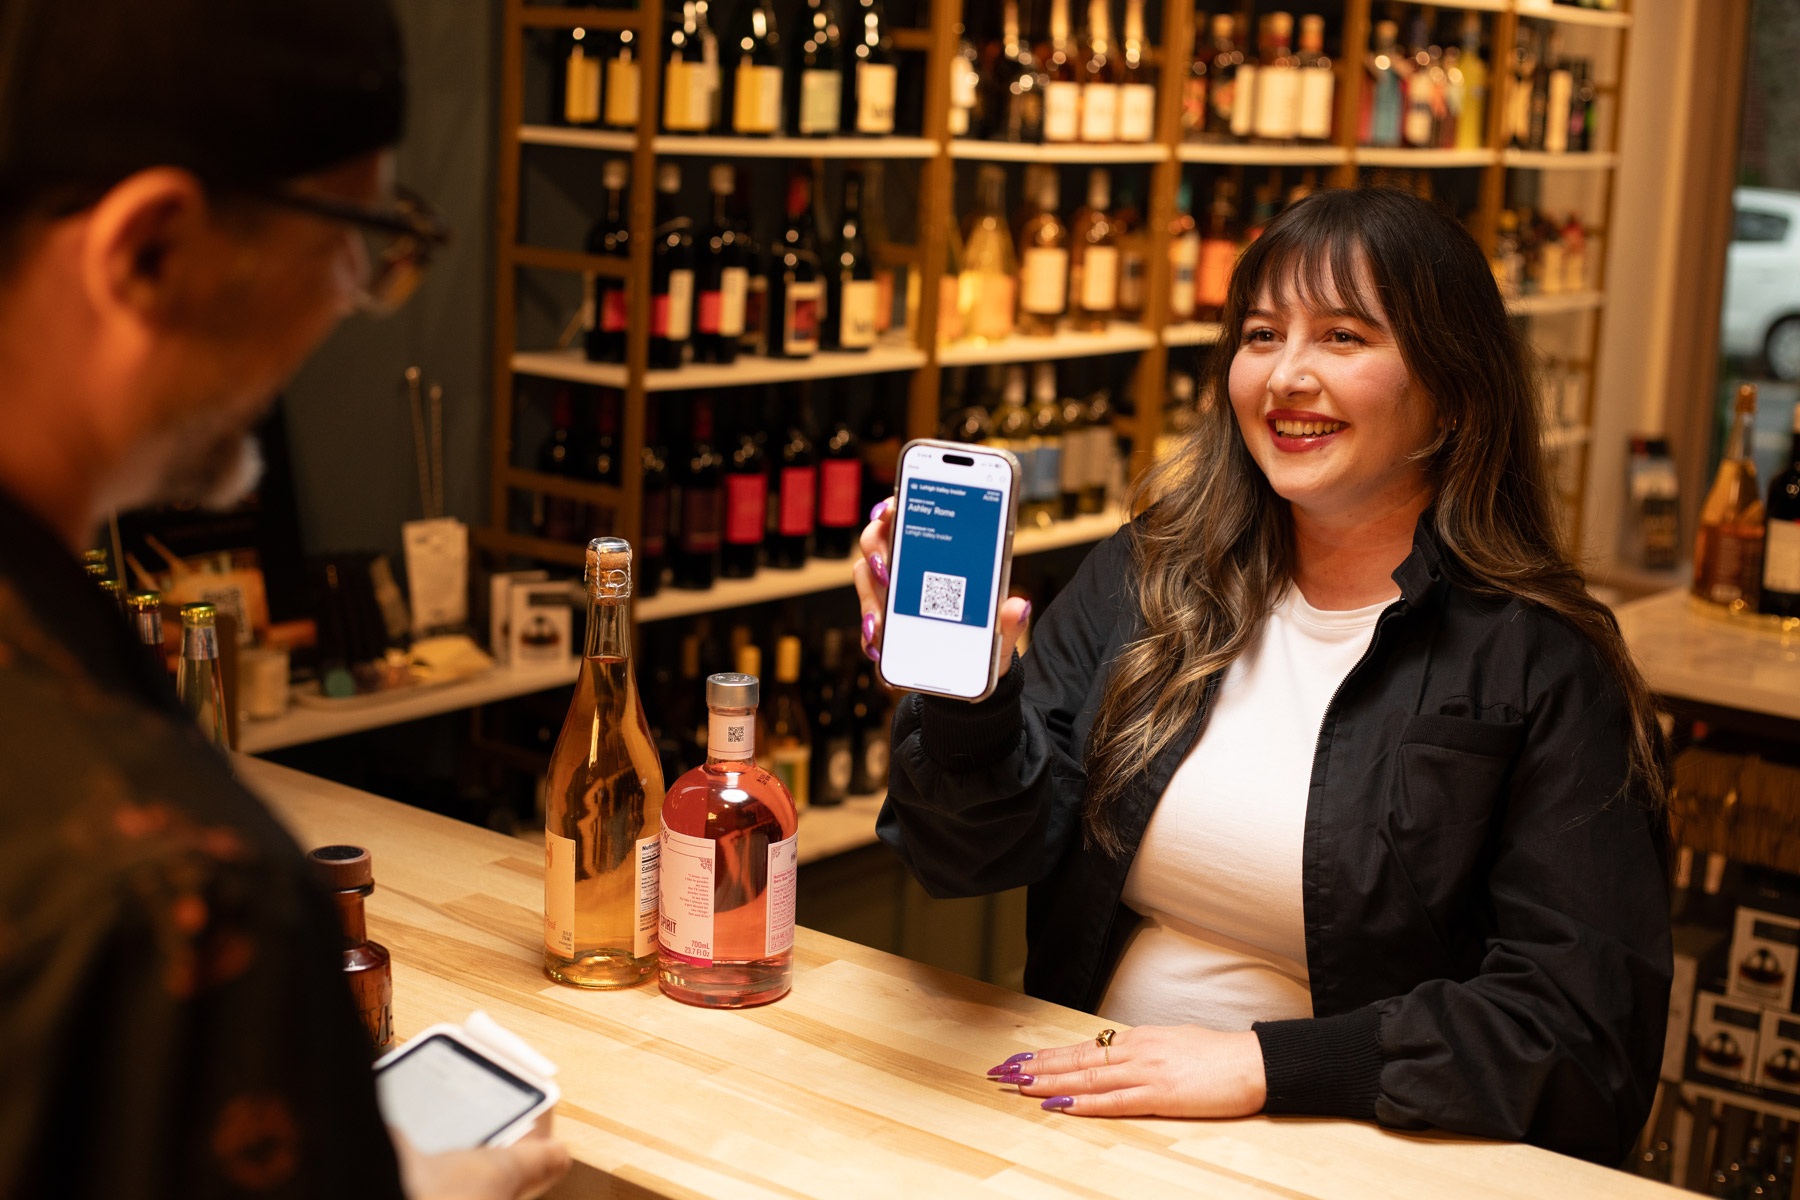
In May 2025, DLV transitioned from Lehigh Valley Ambassador to Lehigh Valley Insider, introducing an elevated in-the-know experience for both DLV partners and Insiders. The initiative removed barriers with no memberships, no courses, and no fees, making it easier for visitors and residents to connect with the best of the region. A free digital wallet unlocks exclusive perks across Lehigh Valley, while a weekly e-newsletter keeps Insiders up to date on where to eat, stay, and play
80 Insider Deals
Get more detailed research, connect with the DLV team, and more. Contact Alex Michaels.


